Overview
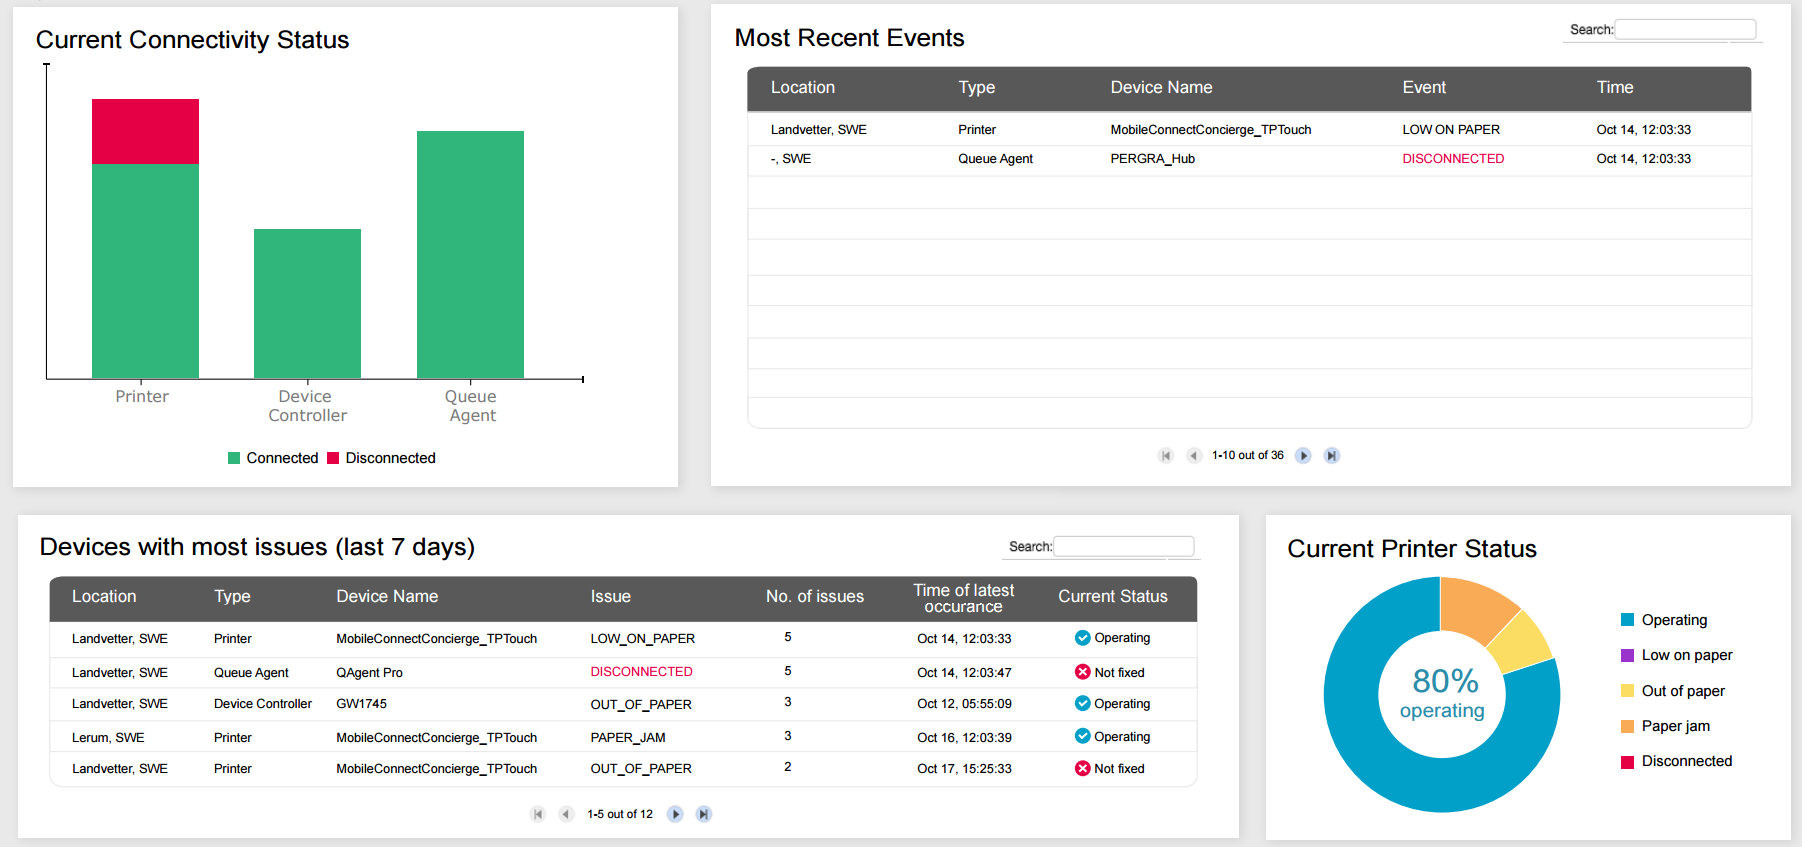
This dashboard gives you an instant overview of the status of the Printers, Queue Agents and Device Controllers in your system.
Here, you can find the following information:
• Current Connectivity Status - a graph showing the number of Connected and Disconnected Printers, Device Controllers, and Queue Agents.
• Most Recent Events - a table showing the most recent (last 7 days) events for your Devices, Device Controllers, and Agents. You can sort the columns, by clicking on the arrows in the header.

If nothing has happened during the last 7 days, this area will be empty and the text
No recent issues. will be displayed.
• Devices with most issues (last 7 days) - this table shows which devices (Printer, Device Controller, or Queue Agent) that have had the most issues during the last 7 days. The columns can be sorted by clicking on the arrows in the headers.
As well as Location, Type, Device Name, Issue, No. of issues, and Time of latest occurance, you can also see the Current Status of the device, i.e if it is currently Operating, or if the issue is still Not fixed.
• Current Printer Status - a pie chart displaying the current status of your printers. In this chart, you can see how large percentage of the printers are running normally, how many are experiencing paper jam, how many are low on paper and how many are completely out of paper.


 If nothing has happened during the last 7 days, this area will be empty and the text No recent issues. will be displayed.