
Name | Definition |
Date | Shows Day, Week, Month, Year, or Weekday, depending on the View parameter. |
Average feedback | The average of all the numeric feedbacks. |
Average waiting time | The average waiting time |
Average transaction time | The average transaction time |
Total number of visits | The total number of Visits |
Number of answers | The total number of answers |
Answer % | The percentage of the total number of Visits that provided an answer. Note: Each Visit is included only once, even if the Customer answered many questions. |

Name | Definition |
Question | Each included question is presented separately. Only include questions with a defined range of answers, not free-text questions. |
Answer | All the available answers defined by the parameter Answers. Note: Also, answers that were never provided should be included and have the number of answers = 0 and no info for waiting time or transaction time. |
Number of answers | The number of Customers who have provided the answer. |
% of total answers | The answers percentage of the total number of answers |
Average waiting time | The average waiting time |
Average transaction time | The average transaction time |

Name | Definition |
Feedback | Each text feedback is presented, even if there are two or more that are identical. |
Branch | Branch name. |
Visit Id | Visit Id. |
Ticket number | The ticket number used for the Visit. |
Average feedback | The average for the numerical part of this Customer’s feedback. |

Name | Definition |
Date | Shows Day, Week, Month, Year, or Weekday, depending on the View parameter. |
NPS | Net Promoter Score NPS = Promoters (%) - Detractors (%) Promoters = 9 and 10 Detractors = 0 through 6. |
Answered (%) | Percent of all served Customers that provided an answer. |
Served | Number of served Customers. |
Average waiting time | Average waiting time for all served Customers. |
Average transaction time | Average transaction time for all served Customers. |
Total, NPS | NPS for all included served Customers. |
Total, Answered | Percent of total number of served Customers that answered. |
Total, Served | The total number of served Customers. |
Total, Average waiting time | The average waiting time for all included Customers. |
Total, Average transaction time | The average transaction time for all included Customers. |
Graph, Y-axis | Fixed 0-100 % if there is no negative value or fixed -100-100% if there is a negative value. |

Name | Definition |
Date | Shows Day, Week, Month, Year, or Weekday, depending on the View parameter. |
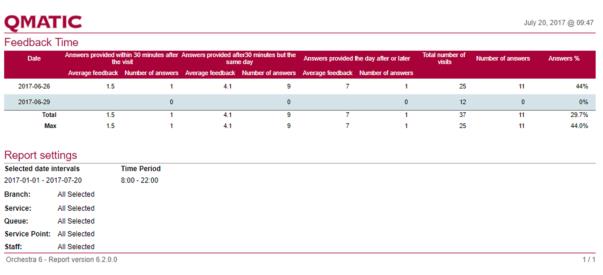
Answers provided within 30 minutes after the Visit | The result of the feedback provided within 30 minutes after the end of the Visit. |
Answers provided after 30 minutes, but the same day | The result of the feedback provided later than 30 minutes after the end of the Visit, but still on the same day. |
Answers provided the day after, or later | The result of the feedback provided the day after the Visit, or later. |
Average feedback | The average of all the numeric feedbacks. |
Number of answers | The number of Customers that provided feedback. |
Total number of Visits | The total number of Visits. |
Answers provided within 30 minutes after the Visit | The result of the feedback provided within 30 minutes after the end of the Visit. |