
Name | Definition |
Service | Service names. |
Delivered service | Name of the Delivered Service. |
Outcome | Name of the Outcome. |
Count | The number of times the Delivered Service or Outcome was registered. |
Outcome % | The percentage of the Delivered Service that had this Outcome. |
Delivered service % | The percentage of the Service that had this Delivered Service. |
Average transaction time | The average transaction time for the transactions for this Delivered Service and Outcome. |
Max transaction time | The longest transaction time for any transaction for this Delivered Service and Outcome. |
Total transaction time | The total time it took to serve the Customer with this Service, Delivered Service and Outcome. |
Total delivered service | The total times the Delivered Service was registered (sum of Outcomes). |
Total service | The total number of Delivered Services for a Service (sum of Delivered Services). |

Name | Definition |
Service | Service names. |
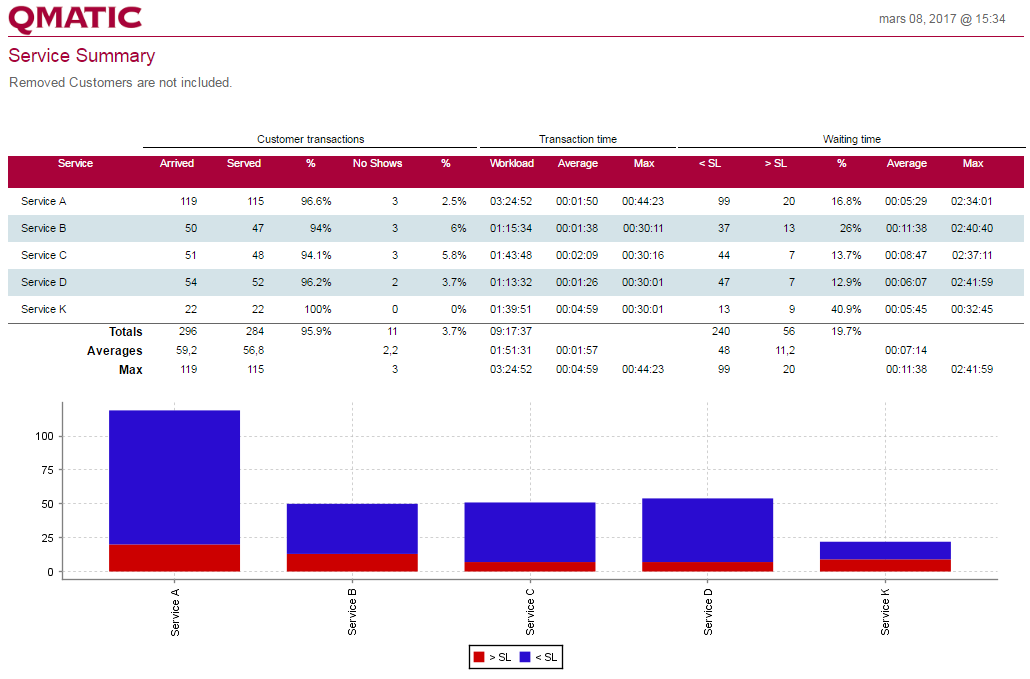
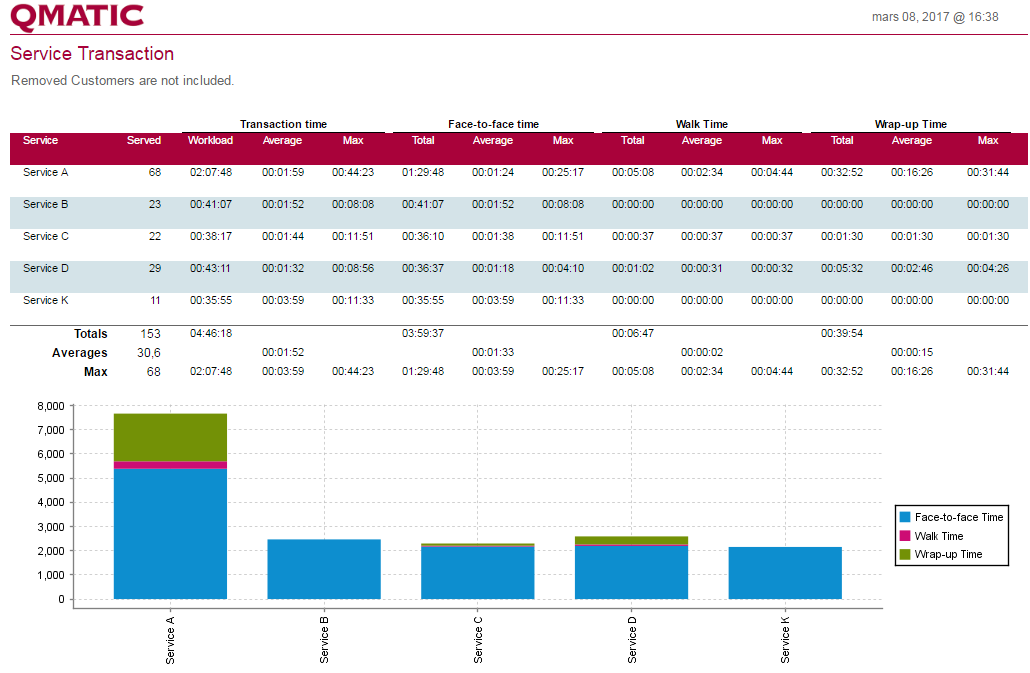
Served | Number of Customers that were served. |
Workload | The total time it took to serve all the Customers. |
Average transaction time | The average transaction time. |
Max transaction time | The longest transaction time. |
Total face-to-face time | The total face-to-face time. |
Average face-to-face time | The average face-to-face time. |
Max walk time | The longest face-to-face time. |
Total walk time | The total walk time. |
Average walk time | The average walk time. |
Max walk time | The longest walk time. |
Total Wrap-up time | The total wrap-up time. |
Average wrap-up time | The average wrap-up time. |
Max wrap-up time | The longest wrap-up time. |
Total number of served | The total number of served Customers. |
Total workload | The total transaction time for all Customers served and included in this report. |
Total of total face-to-face Time | The total face-to-face time for all Customers served and included in this report. |
Total of total Walk Time | The total walk time for all Customers served and included in this report. |
Total of total Wrap-up time | The total wrap-up time for all Customers served and included in this report. |
Average served | The average number of Customers that were served per Service. |
Average of average transaction time | The average transaction time for all transactions included in the report. |
Average of average face-to-face time time | The average face-to-face time for all transactions included in the report. |
Average of average walk time time | The average walk time for all transactions included in the report. |
Average of average wrap-up time time | The average wrap-up time for all transactions included in the report. |
Max served | The maximum number of served Customers for a Service. |
Max workload | The maximum of total transaction time for a Service |
Max average transaction time | The maximum average transaction time for a Service. |
Max of max transaction time | The maximum transaction time for a transaction included in this report. |
Max total face-to-face time | The maximum of total face-to-face time for a Service. |
Max average face-to-face time | The maximum average face-to-face time for a Service. |
Max of max walk time | The maximum face-to-face time for a transaction included in this report. |
Max total walk time | The maximum of total walk time for a Service |
Max average walk time | The maximum average walk time for a Service |
Max of max walk time | The maximum walk time for a transaction included in this report. |
Max total wrap-up time | The maximum of total wrap-up time for a Service. |
Max average wrap-up time | The maximum average wrap-up time for a Service. |
Max of max wrap-up time | The maximum wrap-up time for a transaction included in this report. |

Name | Definition |
Service | Service names |
Served | Number of Customers that were served. |
Workload | The total time it took to serve all the Customers. HH:MM:SS. |
Average transaction time | The average transaction time (hh:mm:ss). |
Max transaction time | The longest transaction time (hh:mm:ss). |
Total face-to-face time | The total face-to-face time (hh:mm:ss). |
Average face-toface time | The average face-to-face time (hh:mm:ss). |
Max walk time | The longest face-to-face time (hh:mm:ss). |
Total walk time | The total walk time (hh:mm:ss). |
Average walk time | The average walk time (hh:mm:ss). |
Max walk time | The longest walk time (hh:mm:ss). |
Total Wrap-up time | The total wrap-up time (hh:mm:ss). |
Average wrap-up time | The average wrap-up time (hh:mm:ss). |
Max wrap-up time | The longest wrap-up time(hh:mm:ss). |
Total number of served | The total number of served Customers. |
Total workload | The total transaction time for all Customers served and included in this report. |
Total of total face-to-face Time | The total face-to-face time for all Customers served and included in this report. |
Total of total Walk Time | The total walk time for all Customers served and included in this report. |
Total of total Wrap-up time | The total wrap-up time for all Customers served and included in this report. |
Average served | The average number of Customers that were served per Service. |
Average of average transaction time | The average transaction time for all transactions included in the report. |
Average of average face-to-face time | The average face-to-face time for all transactions included in the report. |
Average of average walk time | The average walk time for all transactions included in the report. |
Average of average wrap-up time | The average wrap-up time for all transactions included in the report. |
Max served | The maximum number of served Customers for Service. |
Max workload | The maximum of total transaction time for a Service. |
Max average transaction time | The maximum average transaction time for a Service. |
Max of max transaction time | The maximum transaction time for a transaction included in this report. |
Max total face-to-face time | The maximum of total face-to-face time for a Service. |
Max average face-to-face time | The maximum average face-to-face time for a Service. |
Max of max walk time | The maximum face-to-face time for a transaction included in this report. |
Max total walk time | The maximum of total walk time for a Service. |
Max average walk time | The maximum average walk time for a Service. |
Max of max walk time | The maximum walk time for a transaction included in this report. |
Max total wrap-up time | The maximum of total wrap-up time for a Service. |
Max average wrap-up time | The maximum average wrap-up time for a Service. |
Max of max wrap-up time | The maximum wrap-up time for a transaction included in this report. |

Name | Definition |
Branch | Branch name. |
Entry point | The name of the Entry Point. |
Arrived | The total number of Customers that started the Visit at the Entry Point. |
Arrived % | The percentage of Customers that started the Visit at the Entry Point. |